While the CT007-R can be used as a stand-alone unit, pairing it with the Radon Sniffer Companion App can allow users enhanced features and settings. The app can connect to a Sniffer via Bluetooth Low Energy and both Android and iOS system phones are supported. Below is a brief overview of these settings and features. A more detailed description of each can be found further down on the page here.
Settings available on the Radon Sniffer App:
Switch between Smart Mode and Standard Mode
Change display units on the device
Adjust conversion factor
Enable background running
Enable data logging
Features available on the Radon Sniffer App:
Real-time wireless monitoring
Timer mode, which counts alpha particles over a user defined period of time
Emailing logged data
Real-time graphing
Archive of data and graphs
The “Radon Sniffer” app is available on both Android and iOS. Simply search for “Radon Sniffer” in the Play Store or App Store. Or, use the buttons or scan the QR codes below.
The description on operating the app found on this page is written to be true when using an Android phone. If operating on an iPhone, the operation will be quite similar with the primary difference being that the menu will be located on the bottom of the screen.
Connecting your device:
Click the Radon Sniffer app icon, as shown.
App Icon
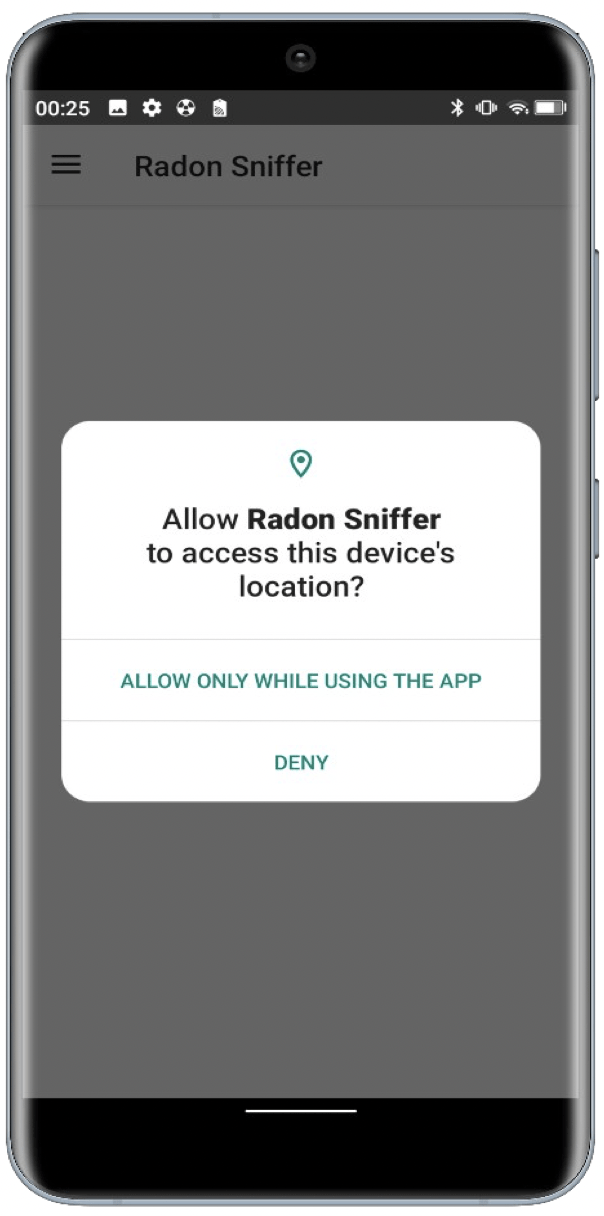
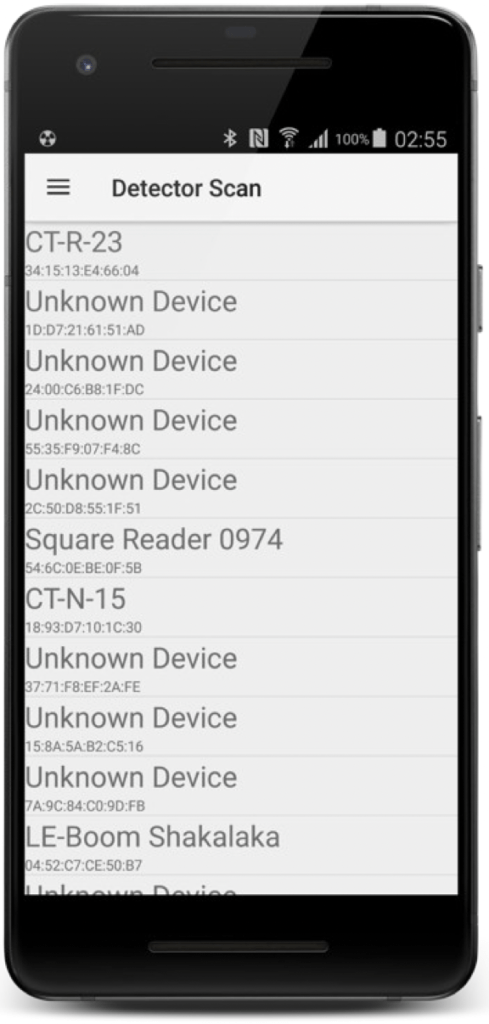
Enable location services. It will then direct the user to the “Detector Scan” screen. Allow the device location to be retrieved. All nearby Bluetooth Low Energy devices will be listed. Choose the one called “CT-R-##”, where ## is the unit number for the detector.
Allow Location Prompt
Detector Scan
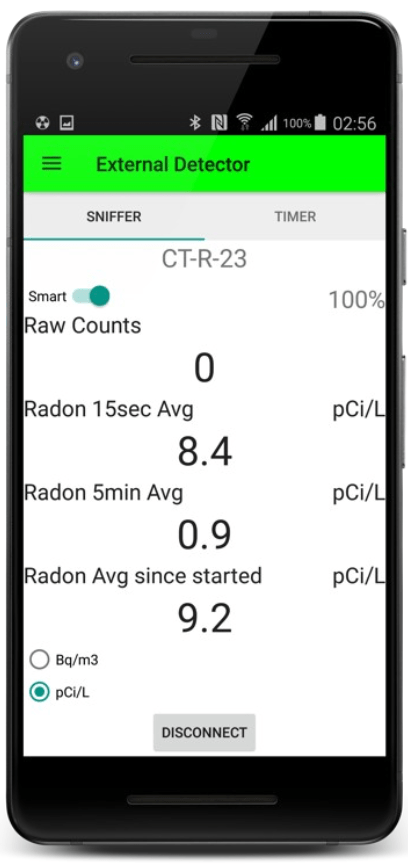
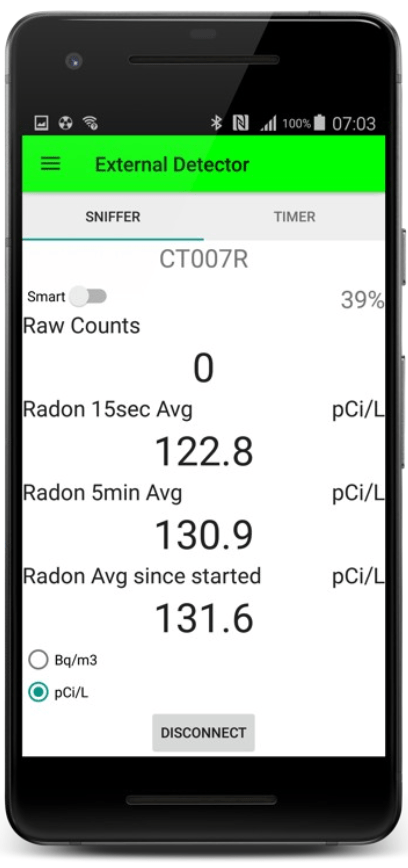
After a successful connection, the default screen will appear. It displays the radon concentration averages in 15-second, 5-minute and overall time intervals. The “Raw Counts” are the detected alpha particles in each second.
Default Screen
All readings from the app are independent of the readings from the detector. Readings from the app are calculated based on the raw radon counts sent from the unit since the connection has been established. Therefore, readings on the app may not be the same as readings on the unit but should be similar.
App Features:
Smart and Standard Mode:
To read in depth about the difference between the two modes, see operation.To learn the basic principle and how to use the app to switch between them, continue reading.
When in the Radon Sniffer app there is a toggle switch on the upper left corner on “Sniffer” tab to enable or disable “Smart” Radon concentration calculations.
“Smart” calculation is the default reading display. It takes the raw number of counts and subtracts the number of counts due to the radon progeny built up in the cell, which it infers from the previous radon measurements. Therefore, “Smart” readings depend on the previous radon levels.
Note: The radon calculations on the CT007-R local display are “Smart” calculations.
If “Smart” calculation is disabled, the calculation directly converts the received raw radon counts for each 15 seconds into radon activity concentration averages. So, each new reading is independent of the previous readings. We recommend using smart mode.
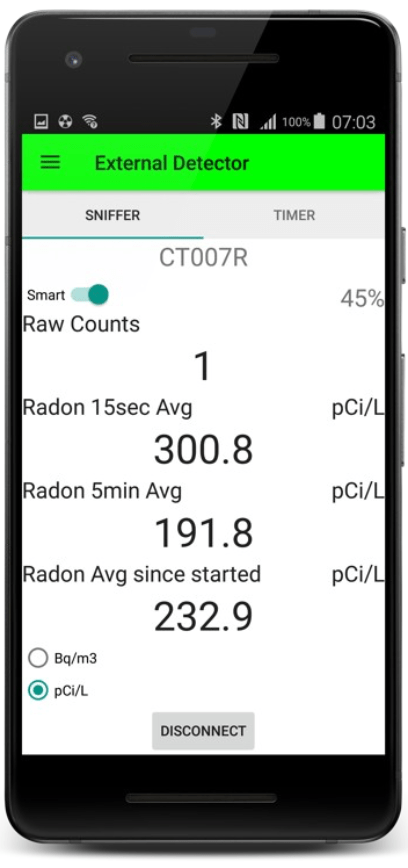
The “Standard” mode is what other scintillation cell-based radon measuring instruments use. It tends to underestimate the radon concentration at the beginning of the sampling sequence and over-estimate at the end once radon progeny has accumulated in the cell. This operation mode will tend to be more stable.
Smart Mode Running
Standard Mode Running
Sniffer:
Sniffer mode is when the CT007-R measures the radon activity concentration either in the 15 second, the 5 minute, or the overall run time average. When viewing sniffing mode on the app, the “Raw Counts” are also displayed, as well with the option to toggle between units.
Timer:
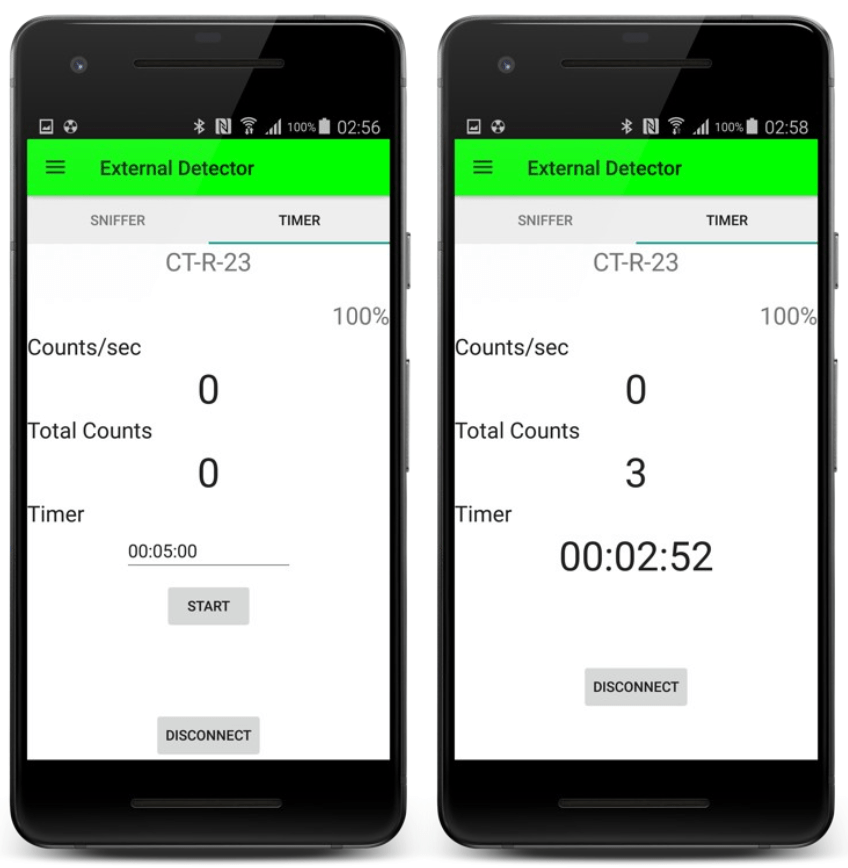
Timer mode allows users to measure the total counts in a specified period. Timer mode is independent of sniffer mode and they will run simultaneously.
To activate timer mode, users can either swipe the screen from right to left or by clicking the “TIMER” option at the top of the screen under the “External Detector” heading.
Before using the timer, enter the desired counting time by typing the time in “hh:mm:ss” format into the given area. If no time is entered, the timer will run for 5 minutes by default.
Click the “START” button to begin the timer mode run. This will accumulate all counts received from the unit to the “Total Counts” for the specified period. “Counts/sec” is the raw radon counts coming in from the connected CT007-R unit for each second. It is always updating, even if the timer is not started. When the time is up, “Total Counts” will continue to display the accumulated counts until the timer is started again.
Timer Mode Running
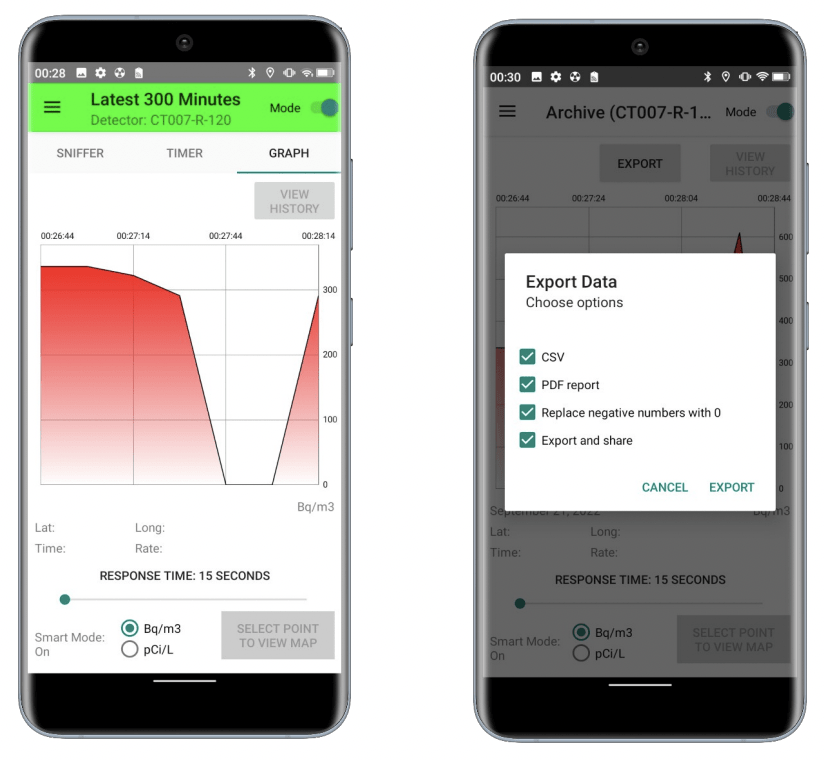
Live graphing:
To view a live graph go to Menu> Settings. Scroll down to find “Live Graphing” and enable it. Then go back to detector views. There will be a third tab at the top called “GRAPH”. Clicking on it will display the live graph.
Using two fingers, users can zoom in or out of the graph. Additional information on specific points of the graph can be accessed by tapping on that point of the graph. Clicking “OPEN MAP” will open a map showcasing the coordinates of the data.
Below the graph, users can toggle the measurement units that the graph is being displayed in.
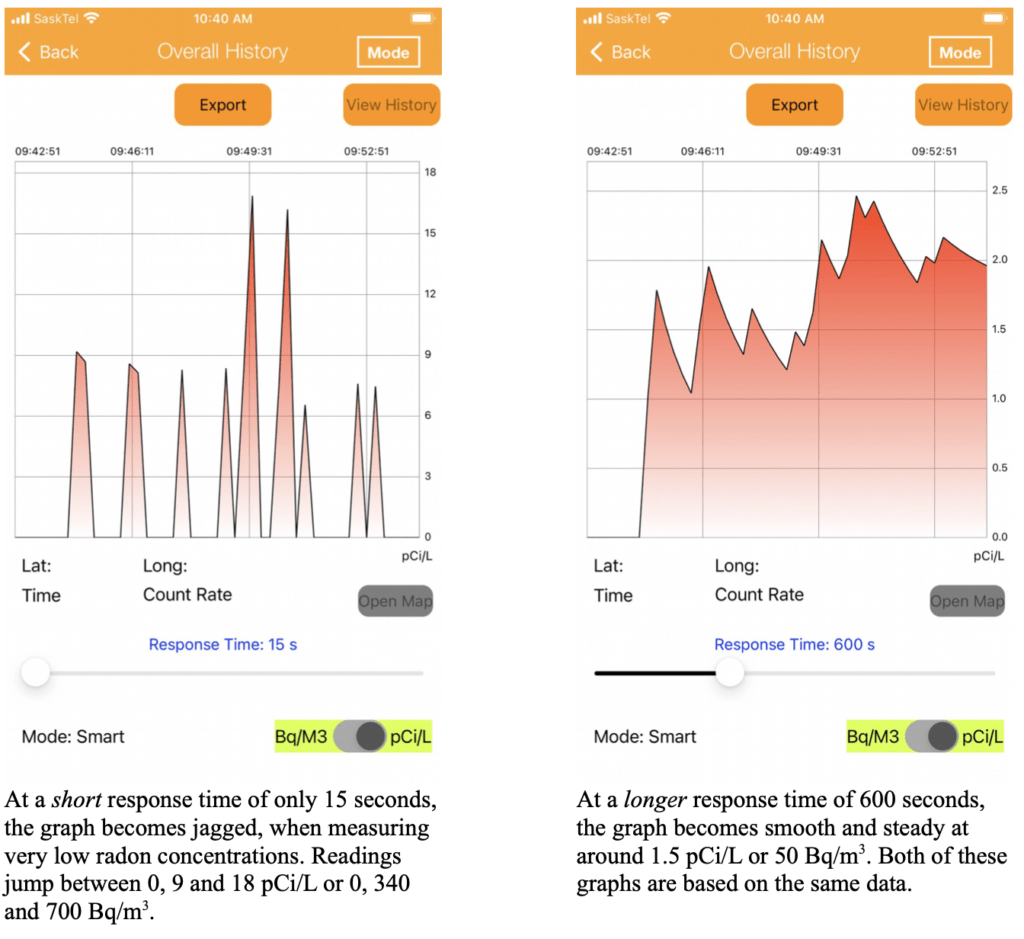
Users are also able to adjust the response time of the graph by dragging the correlating slider. This will change the appearance of the graph but not the data that is recorded. Users can adjust the response time an unlimited amount of times depending on their wishes. It is important to know what response time to use based on what you are measuring.
Shorter response times are ideal for measuring instances where the amount of radon suddenly increases or decreases such as locating radon entry points. If a long response time is used for a sudden increase or decrease it will be averaged out and not as noticeable to the viewer. Longer response times in comparison are beneficial when the readings are low and a steady average is needed. When using fast response time on low background levels, the results will look unstable as the detector will likely only be getting singular counts every so often, resulting in a graph that constantly is jumping from readings that correspond to 1 count- sometimes 2, back to 0, and so on. However, when the response time is adjusted, the average of background counts is better displayed. More information about which response time to use can be found on the Radon Sniffer operation page.
Data Export:
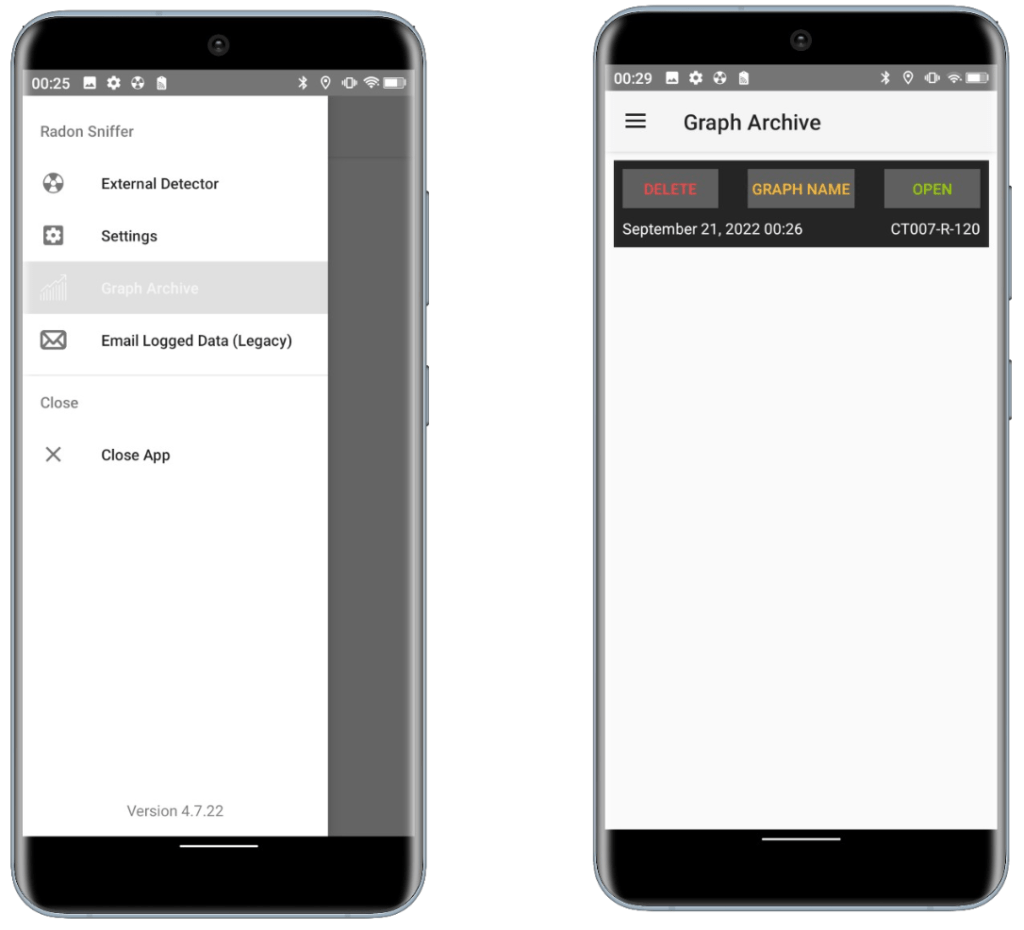
Live Graphing must be enabled in order to export the data. To export saved data, open the menu and select “Graph Archive.” The saved data will then be listed with the date of the reading and the options to delete, rename, or open the data. To export data, select “OPEN”. The archived graph will then be displayed with similar options to the live graph view. Tap the “EXPORT” option at the top of the graph. A pop up with a series of options will appear. One option is “Replace negative numbers with 0”, this always needs to be selected. The other options are user selectable. Users can select which file type(s) they would like to export with a PDF file as well as CSV file as options. They then will be able to save the data in a local folder on the smartphone. If users would like to not only save, but also share the data, they can select “Export and share”. They will then be prompted to choose a program to share the data via, such as “e-mail”. The selected option will then open with files as an attachment.
Graph Archive
Data Export
App Settings:
In conjunction with enhanced features, the Radon Sniffer app also provides additional settings. To navigate these settings, access the menu bar from the top left corner of the app. Select the “Settings” option. Some settings are secure, this will mean that a window will pop up asking users to enter a password to access secure settings. The default password is “1234”.
The following settings are available:
Detector Display Unit:
This will update units that are displayed on the detector.
Conversion Factor:
The default conversion factor is 340 [Bq/m3/counts/15sec]. The conversion factor can be changed on the app, but this change will not be reflected on the detector.
Data logging:
This is necessary to be turned on to get access to the graphing and exporting data features. To enable this, users must toggle the switch to the activated position. If a user wants to remove this feature, they can deactivate it by toggling the switch once again.
Background running:
This means that the Radon Sniffer app will run while the app is open in the background of the smartphone. This gives users multipurpose use of their phone by allowing them to perform other tasks while the app is still running and collecting data. To enable this feature, users have to toggle the switch so that it is activated. To deactivate it, users have to do the opposite and deactivate the switch.
On the app, calculations are performed independently from the local CT007-R. Users can switch display modes, units or conversion factors on the fly without affecting the CT007-R. The app is demonstrated in this video.